Business Information
This is the management information of Wooju E&C Corp. and Wooju Construction Corp.
that gives trust and trust to customers with the best effort.
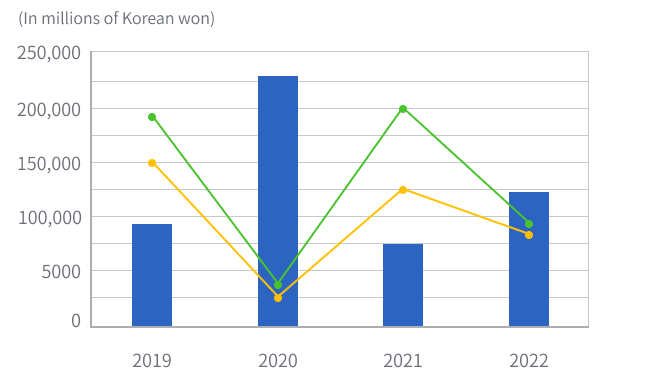
Business Performance Trend
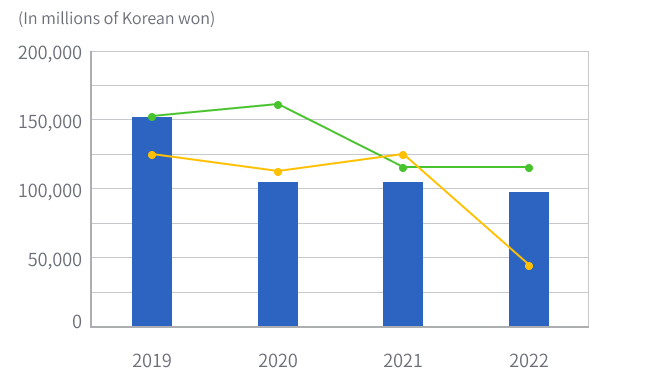
- Sales
- Operating margin
- Net margin
Sales and profitability analysis
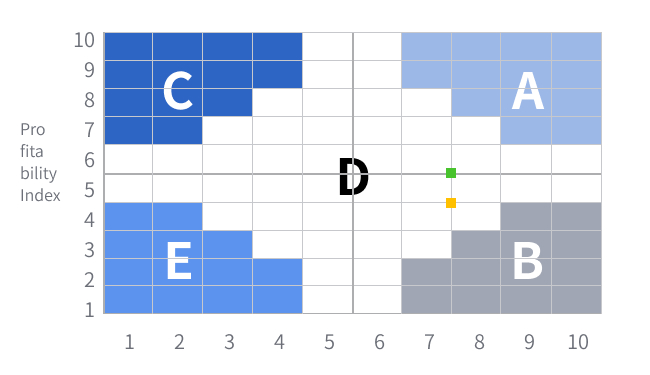
- 2021 years
- 2022 years
Division |
Total assets |
Total liabilities |
Total equity |
Sales |
Operating profit |
Net Income |
|---|---|---|---|---|---|---|
| 2022-12-31 | 54,492 | 13,658 | 40,833 | 107,512 | 5,293 | 1,763 |
| 2021-12-31 | 52,930 | 12,427 | 40,503 | 112,403 | 5,538 | 6,094 |
| 2020-12-31 | 47,931 | 13,391 | 34,540 | 114,067 | 7,197 | 5,676 |
Borrowing structure analysis
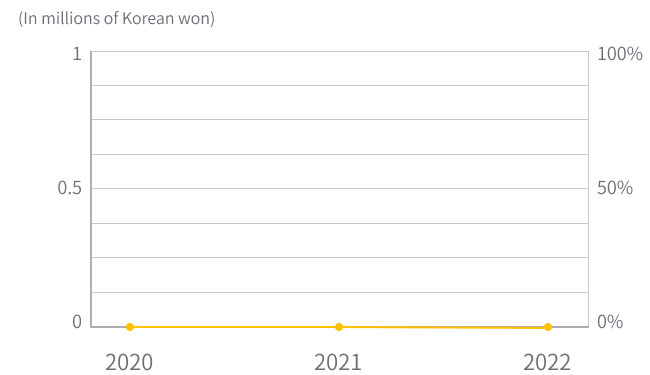
- short-term
- long time
- Borrowing dependence
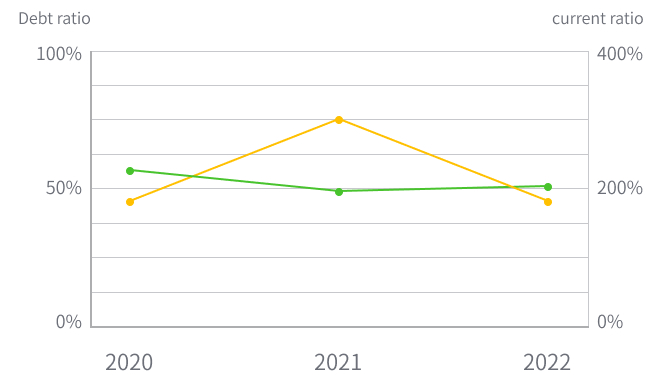
Stability indicator analysis
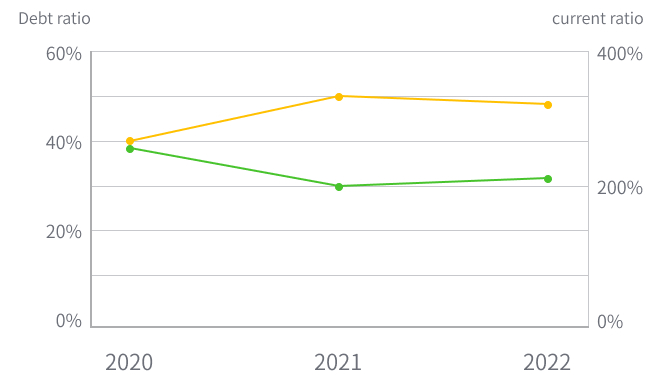
- Debt ratio
- Current ratio
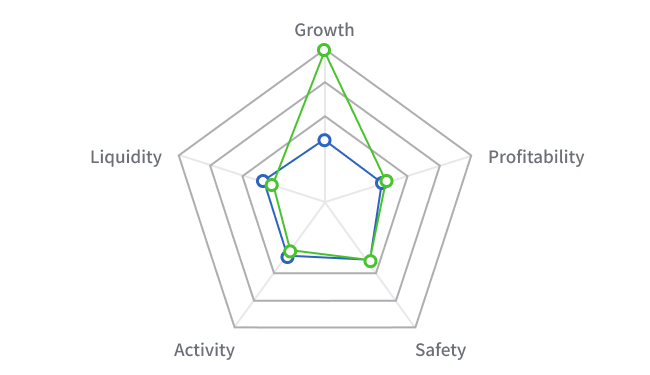
Competitive advantage analysis compared to the same industry
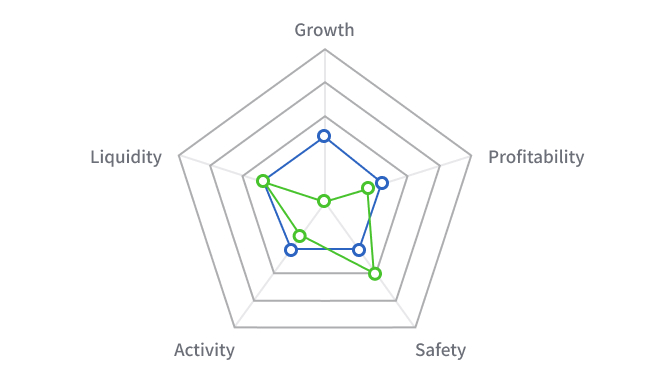
- Financial ratio
- ECR average
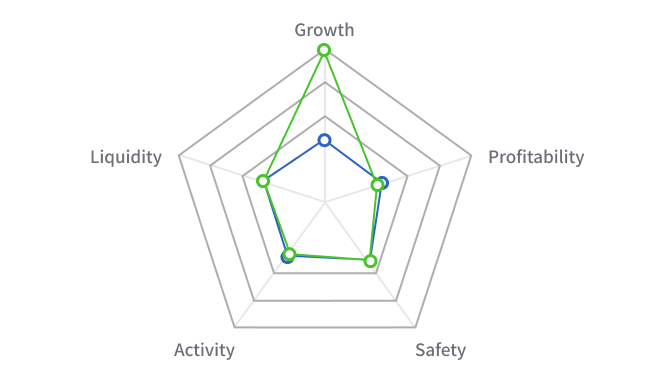
Analysis of competitive advantage compared to superior companies
- Financial ratio
- Excellent business group
Division |
Sales growth rate |
Operating margin |
Net margin |
Current ratio |
Debt ratio |
Borrowing dependence |
|---|---|---|---|---|---|---|
| 2022-12-31 | -4.4 | 4.9 | 1.6 | 344.5 | 33.5 | 0.0 |
| 2021-12-31 | -1.5 | 4.9 | 5.4 | 354.2 | 30.7 | 0.0 |
| 2020-12-31 | -20.8 | 6.3 | 5.0 | 289.7 | 38.8 | 0.0 |
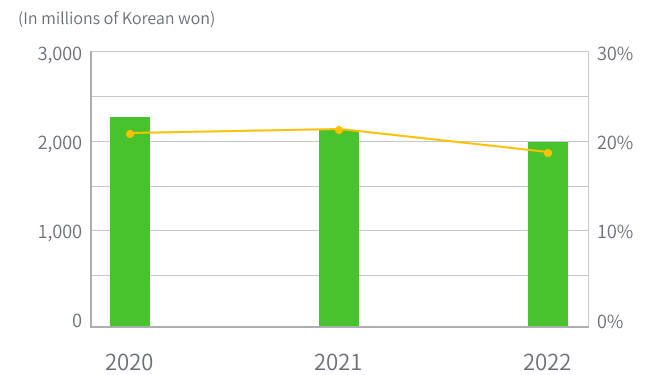
Business Performance Trend
- Sales
- Operating margin
- Net margin
Sales and profitability analysis

- 2021 years
- 2022 years
Division |
Total assets |
Total liabilities |
Total equity |
Sales |
Operating profit |
Net Income |
|---|---|---|---|---|---|---|
| 2022-12-31 | 11,515 | 3,993 | 7,522 | 9,752 | 345 | 284 |
| 2021-12-31 | 10,666 | 3,429 | 7,237 | 6,977 | 550 | 333 |
| 2020-12-31 | 11,361 | 4,458 | 6,903 | 21,747 | 296 | 204 |
Borrowing structure analysis
- short-term
- long time
- Borrowing dependence
Stability indicator analysis
- Debt ratio
- Current ratio
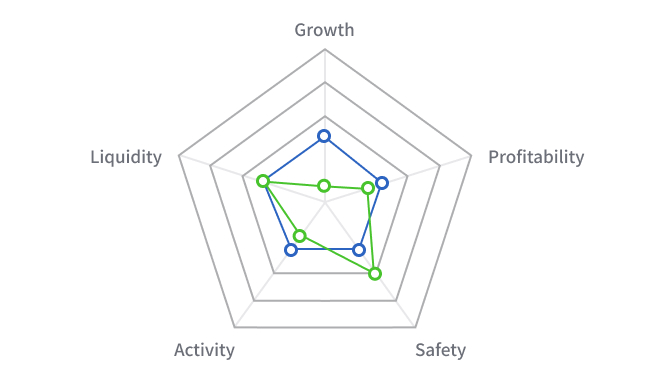
Competitive advantage analysis compared to the same industry
- Financial ratio
- ECR average
Analysis of competitive advantage compared to superior companies
- Financial ratio
- Excellent business group
Division |
Sales growth rate |
Operating margin |
Net margin |
Current ratio |
Debt ratio |
Borrowing dependence |
|---|---|---|---|---|---|---|
| 2022-12-31 | 39.8 | 3.5 | 2.9 | 225.3 | 53.1 | 17.4 |
| 2021-12-31 | -67.9 | 7.9 | 4.8 | 445.5 | 47.4 | 22.0 |
| 2020-12-31 | 142.6 | 1.4 | 0.9 | 213.9 | 64.6 | 21.6 |
Tel +82-61-686-0414 | Fax +82-61-685-1184